
Statistical Analysis
Statistical analysis you can defend for Significant. Verifiable. Defensible. Replicable.
Postgraduate statistical analysis across SPSS, R, Python, NVivo, STATA, and EViews, delivered with real software outputs, written interpretation, and the syntax file so you can replicate every test we run.
This is for you if...
You have data, or you are about to collect it, and the analysis chapter is where the dissertation stands or falls. You may be:
A quantitative dissertation student where Chapters 4 and 5 need the analysis written up properly.
A researcher with raw data but no clear analysis plan, and the deadline is closing.
A researcher with raw data but no clear analysis plan, and the deadline is closing.
Tools we work in
We run analysis in the software your marker, supervisor, or external examiner can open. You get the syntax file, the output, and the cleaned data. Everything we run can be re-run.
SPSS
Descriptive, inferential, regression, ANOVA, factor analysis, reliability
R
Advanced stats, structural equation modelling, machine learning, replication code
Python
Data wrangling, ML, NLP, large datasets, reproducible Jupyter notebooks
NVivo
Qualitative coding, thematic analysis, framework analysis, mixed-methods
STATA
Econometrics, panel data, causal inference, instrumental variables
EViews
Econometric forecasting, time series analysis, panel data models, ARIMA
Excel
Smaller datasets, descriptive analysis, pivot tables, exploratory work
Power BI
Data visualisation, dashboards, business intelligence reporting
Tableau
Interactive dashboards, geographic analysis, visual storytelling
Your supervisor requires software not on this list? Send us the brief. We tell you upfront whether we have an analyst for it.
Analysis types we deliver
Pick the analysis that fits your research question, your data type, and your supervisor's expectations. We use the right test, not the trendy one.
Descriptive statistics
Means, medians, frequencies, distributions. The baseline for almost every quantitative dissertation.
Inferential tests
T-tests, ANOVA, chi-square, correlation. Hypothesis testing for group differences and relationships.
Regression analysis
Linear, multiple, logistic, hierarchical. For predicting outcomes from predictors and identifying significant variables.
Factor analysis
EFA and CFA for survey instruments. Construct validation. Dimension reduction.
Structural Equation Modelling
SEM, path analysis, mediation, moderation. For testing complex theoretical relationships.
Time series & longitudinal
Repeated measures, growth curves, panel data, ARIMA. For data with a time dimension.
Qualitative coding
Thematic analysis (Braun & Clarke), framework analysis, IPA, grounded theory. Coded in NVivo or by hand.
Mixed methods integration
Joint displays, meta-inference, triangulation. Bringing quant and qual together coherently.
Real analysis. Not generated. Reproducible.
ChatGPT can fabricate statistics that look real. AI can hallucinate p-values, citations, and effect sizes. Real analysis leaves a trail. Here is what you actually receive.
# Model: Y ~ X1 + X2 + X3
> summary(model_full)

Call:
lm(formula = engagement ~ age +
   training_hours + autonomy)

Residuals:
    Min      1Q  Median      3Q     Max
-2.1422 -0.5234  0.0921  0.5102  1.8732

Coefficients:
               Estimate Std. Error t value
(Intercept)     2.41273    0.31204   7.73
age            -0.01892    0.00451  -4.20
training_hours  0.34521    0.04832   7.14
autonomy        0.21043    0.06127   3.43

Multiple R-squared: 0.4267
F-statistic: 48.31 on 3 and 196 DF
p-value: < 2.2e-16
The full reproducibility package
Every analysis we deliver comes with the files that prove it is real. Anyone (your supervisor, your external examiner, your viva panel) can re-run the entire analysis on their own machine.
- The cleaned dataset (CSV or SPSS .sav)
- The syntax or code file (R script, Python notebook, SPSS syntax)
- The full output file (PDF or HTML)
- Written interpretation in academic prose
- Assumption checks for every test
- Effect sizes alongside p-values
Our commitment to your work
We cannot guarantee a specific mark. No academic writing service honestly can. A mark depends on factors beyond any writer's control: the marker's expectations on the day, the specific rubric weighting, the moderator's review, the external examiner's preferences.
What we can guarantee is the quality of what we hand you BEFORE you submit it.
Our commitment
- Every chapter is written to distinction-grade standard in our internal assessment before it leaves our team
- We run pre-submission AI detection and plagiarism checks on every chapter, share the reports with you, and rewrite anything that flags
- We deliver one round of free revisions based on your supervisor's feedback
- We do not deliver work that we would not stake our twelve-year reputation on
- If at any stage you feel the work is not at the standard we promised, we revise until you are confident enough to submit
This commitment is the same one we have honoured since 2014. It is why over 1,200 students have trusted us with their dissertations.
Meet the founder
Specialists do the writing. I match clients to the right specialist, read first drafts, and stand behind every dissertation we deliver.
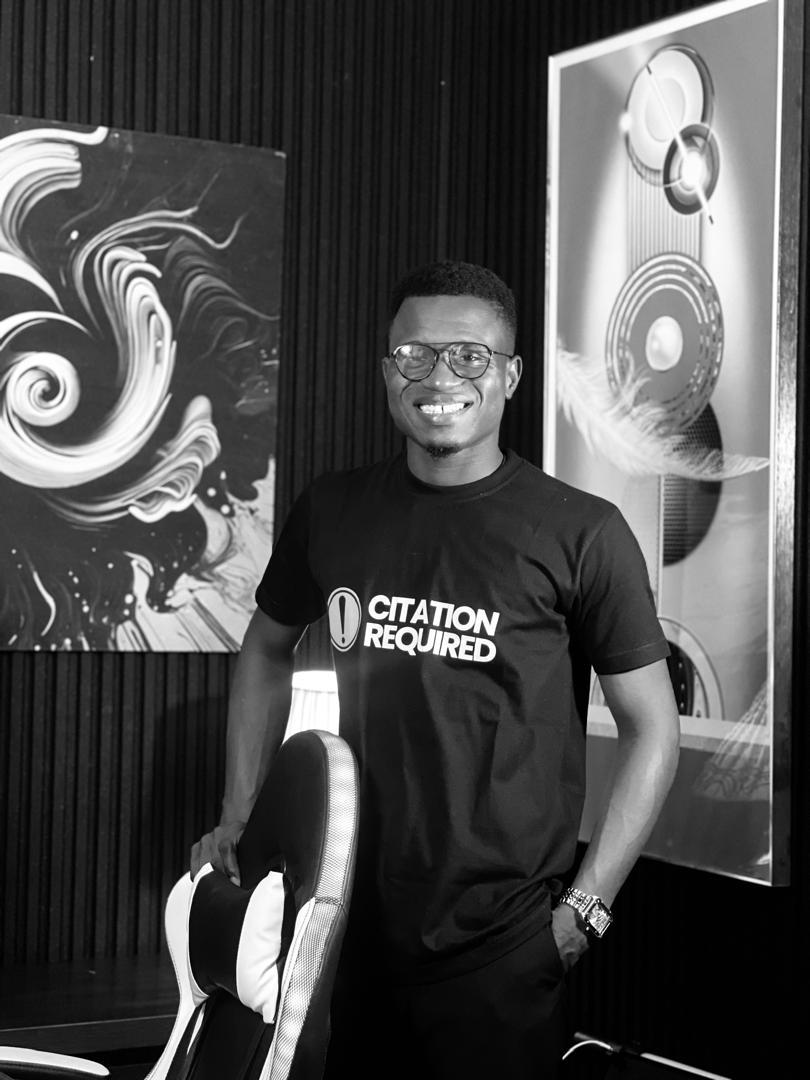
Taiwo Oladokun
Founder & Head of Specialists, Delight Data Exploration
DDE started in 2014 with one writer (me) taking on dissertation chapters for Nigerian postgraduates who were drowning at UK universities. The work paid off. Word spread. One writer became eight specialists.
Twelve years later, I still personally match every client to the right specialist. I still read first drafts. I still answer the WhatsApp messages at half past ten at night when a dissertation deadline is forty hours away. If you bring me your brief, I am the person who decides whether we can deliver. If we can, you get a small team who treat your degree like it is theirs. If we cannot, I tell you upfront.
And the analysts running your numbers
Three of our eight specialists, anonymised for their privacy. Each one writes only in their subject specialism. You will meet your matched specialist on your free consultation call.
Healthcare & Nursing Lead
PhD candidate · 11 years clinical practice
Eleven years adult nursing practice plus four years writing for postgrads. Trained in qualitative evidence synthesis (SPIDER, PICO), mixed methods, thematic analysis. Regular at Glasgow Caledonian, Manchester, Cardiff.
Business & Strategy Lead
MBA · 9 years industry consulting
Strategy and operations consulting for nine years before joining DDE. Writes across strategic management, marketing, organisational behaviour, finance, and HR. Strong on Porter, RBV, Ansoff, blue-ocean frameworks.
Data & Quantitative Lead
MSc Data Science · 7 years research
Quantitative dissertations across data science, business analytics, economics, and social sciences. Comfortable with SPSS, R, Python, NVivo, STATA, EViews. Handles regression, structural equation modelling, machine learning chapters.
Identities withheld to protect specialist privacy. Real credentials, real track record. Five more specialists on the team across Engineering, Education, Law, Social Sciences, and Humanities.
Real outcomes from students we have worked with
These are real grades from real students we have worked with. Names redacted for privacy.
Adult Nursing essay
UK university · May 2025
Advance Leadership paper
UK university · May 2026 · 10% similarity
2,000-word academic essay
UK university · May 2026
Strategy & Competition project
UK university · April 2026
Adult Nursing Care assessment
UK university · May 2026
Nursing Values essay
UK university · 2025 · Merit
More verified outcomes available on request during your free consultation. Twelve years of work across UK, US, Canadian, Australian, and Nigerian universities.
Common questions
How much does statistical analysis cost?
We do not publish fixed prices because every dissertation brief is different. Variables include word count, deadline, subject complexity, referencing style, and your stage of the project. Bring your brief, your deadline, and your budget to the free consultation. We tell you exactly what is possible.
Will my work pass Turnitin and AI detection?
Yes. Every dissertation is human-written by our specialists, not AI-generated. We test our work against the same tools your university uses (Turnitin, GPTZero, Originality AI, Copyleaks) BEFORE we deliver, share the reports with you, and rewrite anything that flags. Twelve years of zero plagiarism incidents.
My deadline is in three weeks. Can you still help?
Most likely yes. Three weeks is enough time for two to three chapters at standard turnaround, or a complete short-form dissertation with rush turnaround applied. Send your brief today and we tell you exactly what is possible by your deadline.
What if my supervisor changes the direction halfway through?
We expect this. Supervisor pivots are normal. One round of revisions is included free in your project price. If the pivot is substantial (new research questions, new methodology), we quote the additional work upfront so you can decide.
How do I pay, and is it safe?
You pay through our secured payment gateway via card, bank transfer, or Paystack. We do not require full payment upfront. We typically work in milestones: a deposit to begin, balance on delivery, with longer projects split across more milestones.
Will anyone know I used your service?
No. Confidentiality is absolute. Our specialist who writes your work signs a non-disclosure agreement. Your work is delivered to your private email only. We do not publish your name, your university, or your topic. The work is yours from the moment we hand it over.
Stop hoping the analysis works. Start running tests you can defend.
You have data. You have a marker who will ask defending questions. You have a viva or an external examiner waiting. Twelve years of running quantitative and qualitative analysis later, we know what holds up under scrutiny.
Book a free twenty-minute consultation. Tell us your deadline. We will tell you exactly what we can deliver and when.
Other ways we can help
Not quite the service you need? We also help with other parts of the academic and career journey.
Research Proposal
For students at the start of their dissertation journey
Explore →Editing & Proofreading
You have a draft, we polish it to distinction standard
Explore →Statistical Analysis
SPSS, R, or NVivo support for your data chapter
Explore →CV & LinkedIn
Ready to land the role your degree is for?
Explore →